OPENPUBLICA · PUBLIC MEETING RECORD
Record of Proceedings
Broward County Transportation Surtax Oversight Board Performance Dashboard Workshop - October 30, 2026
Upcoming and Archived Meetings — Friday, October 30, 2026
BodyBroward County, Florida
SessionUpcoming and Archived Meetings
DateFriday, October 30, 2026
StatusNEW · FILED
Video Record
STREAMING COPY IN PREPARATION — RECORDING AVAILABLE FROM THE ORIGINAL SOURCE
Transcript — Verbatim
Speaker numbers apply only to this recording. Names come from transcript evidence. “Possibly” marks uncertain attribution.
Discussion Breakdown — Share of Meeting
Transportation Safety47%
Technology and Innovation26%
Engineering And Infrastructure16%
Economic Development5%
Public Engagement2%
Procedural2%
Procurement And Contracting2%
Summary of Proceedings
Broward County Transportation Surtax Oversight Board Performance Dashboard Workshop - October 30, 2026
Discrepancy Note: The agenda listed the meeting start time as 1:30 PM local time, while the accompanying metadata specifies a UTC timestamp of 2026-10-30 18:45:00+00:00. No minutes from the meeting were available.
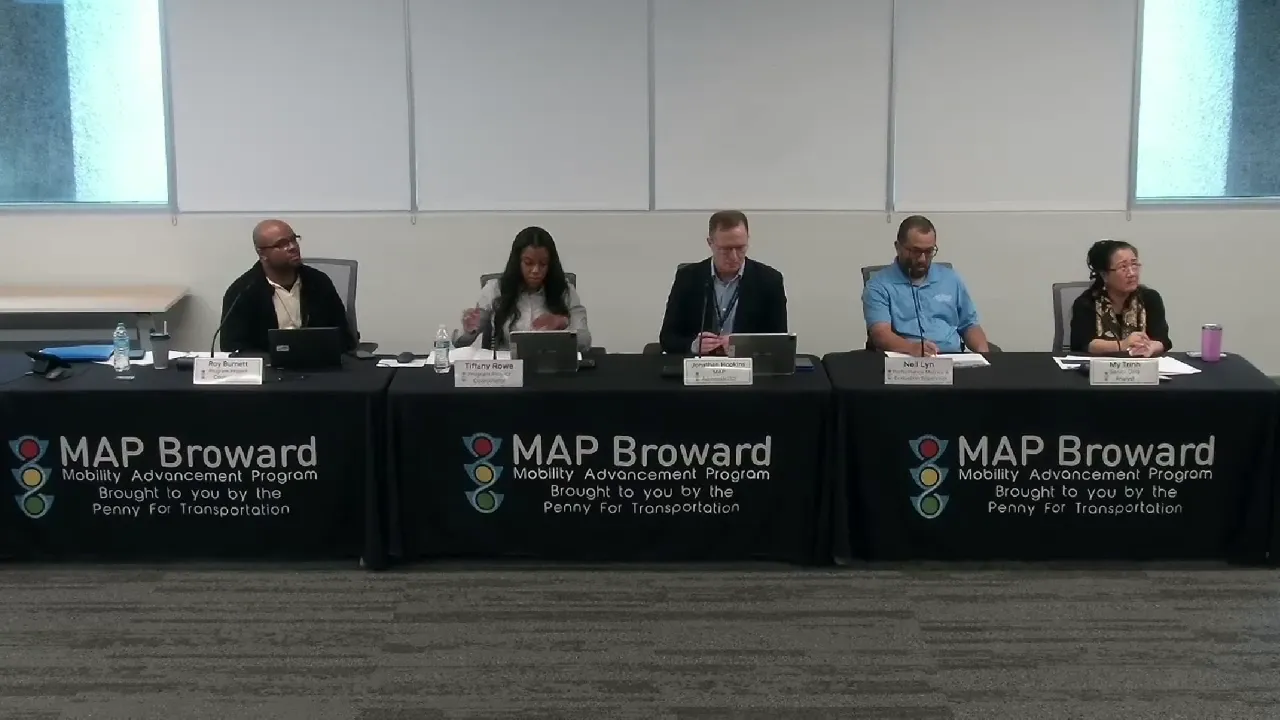
The Independent Transportation Surtax Oversight Board held a virtual workshop to review best practices in performance metrics dashboards used by peer transportation surtax programs. MAP Administrator Jonathan Hopkins facilitated the session. The Performance Metrics and Evaluation Team, led by Tiffany Rowe, presented research findings to inform the development of MAP's next-generation public dashboard.
Discussion Items
- Performance Dashboard Peer Review: Tiffany Rowe presented research on 18 voter-approved transportation measures across nine states. Six key insights were identified: organizing dashboards around the voter promise, leading with an interactive map, providing budget versus spending transparency, listing targets alongside progress, separating outputs (what was built) from impacts (system-level changes), and building layers of detail from overviews to individual projects.
- Peer Program Spotlights: Detailed analyses of three peer programs were shared:
- Seattle (Move Seattle Levy): A $930 million, 9-year program noted for separating project delivery outputs in its main dashboard from system impacts in a separate dashboard called "Moving the Needle."
- Phoenix (Transportation 2050): A $16.5 billion, 35-year sales-tax program, identified as the most comparable to MAP in scale and tax structure. It uses a narrative, story-based website rather than a traditional dashboard, supported by detailed formal reports.
- Columbus (Link Us): An $8 billion program by the Central Ohio Transit Authority, highlighted for its one-screen program snapshot and consistent tri-annual progress reports tied to service changes.
- MAP Dashboard Concept Design: A conceptual mock-up was presented incorporating the six insights into a single-screen interface with categories, map, budget tracker, progress bars, outputs vs. impacts, and navigational links.
Board Feedback & Positions
- Chair Pennant Wallace expressed strong support for the presentation and the direction of the work. He specifically advocated for the inclusion of impact metrics beyond the strict voter promise, such as safety improvements, job creation, economic impact, and minority business (CBE) participation. He also requested that the dashboard highlight matching funds and the growth of the initial investment, calling these "added value" metrics that tell a fuller story.
- Vice Chair Ray praised the presentation as a "Rosetta Stone" that provides a clear macro-level understanding of the program's impact. He inquired whether the dashboard would replace the existing project-level tool or be a new platform. Staff clarified the existing dashboard would remain, with new segments added through a minimum viable product (MVP) approach over several years.
- Board Member Ardal commended the peer benchmarking effort and suggested exploring how future board meetings could be aligned with the voter promise categories, proposing meetings be structured around the ballot measure's investment themes.
- Board Member Ken Ortner stated the presentation was "excellent" and helped him better understand the program's purposes and public reporting goals.
- Board Member Kuhlman raised significant concerns regarding the Third Amendment. He reported cities had been told they could no longer request new major capital projects, calling this "disturbing" and "not right." He requested a detailed spreadsheet of all committed funds.
- Staff Response: Nathaniel and Jonathan Hopkins clarified the situation arises from a backlog of previously programmed major capital projects. The proportion of funding allocated to cities remains consistent, and the maintenance-focused items were specifically requested by the cities through the BCCMA. New capital project solicitations are expected after the current five-year plan ends in 2032.
Key Outcomes
- General Concurrence: Board members expressed general support for the proposed dashboard design, particularly its organization around the voter promise and its separation of outputs and impacts.
- Dashboard Timeline: A fully-featured dashboard is not expected in 2027. An MVP will be released, refined with public and board feedback, and enhanced with features over several years.
- Performance Audit Integration: The board and staff agreed to integrate findings from the upcoming performance audit into the dashboard recommendations. Audit results are anticipated for the December 10, 2026 meeting.
- Meeting Structure Proposal: Staff proposed organizing the 2027 meeting calendar around the seven ballot measure categories, to be discussed and shaped further at the December meeting.
- Follow-Up on City Funding: Staff will prepare a detailed financial spreadsheet and hold one-on-one briefings with board members, particularly Chair Kuhlman, to explain the city funding backlog, the Third Amendment, and the timeline for future capital project cycles.
Meeting Transcript
Everybody, this is Jonathan Hopkins, Map Administrator. It's 1 32 p.m. And good afternoon to everybody, the board members and members of the community. Thank you for joining for our October 30th board workshop on performance dashboard best practices. Today's meeting is part of our initiative to share peer spotlights from around the country on key topics for the Oversight Board so the board can make recommendations informed by a range of practices. Today's presentation is possible thanks to the work of the Performant Metrics and Evaluation Team, which includes Neil Lynn, Mai Tran, Tiffany Rowe, Marlene Bruneau, and with assistance of Carol Munamera. Presenting today is the lead in this research evaluation project, Tiffany Rowe. I'll turn it over to her shortly with the team's research findings. After she presents, we will open the floor to questions and comments from the board, which will help inform our team's next steps in developing our next generation performance dashboard. So with that, Tiffany, it's all yours. Good afternoon, members of the board. My name is Tiffany Rowe, program project coordinator. Thank you for joining today. Today I'll share findings from our research on 18 pair transportation measures. We reviewed how these programs report progress and performance to the public and how their practices can inform MAPS public dashboard and formal reporting. To frame our discussion, here's a brief overview of today's agenda. We'll begin with our current public dashboard, then review the peer measures we researched, and the six key insights from that review. From there, we'll take a closer look at three peer programs, review a conceptual design for MAPS dashboard, and close with questions and discussion. We ask that you hold your feedback and questions until the end of the presentation. With that, let's begin with where we are today. This is our current public dashboard. It offers a project level view of transportation surtax projects from 2019 through 2031. Residents can search by address, project name or ID, and filter by project type and phase. Residents can also filter projects by municipal and commission district boundaries. Selecting a project displays its description, location, phase, fiscal year of award, and total surtax funding. With that baseline in mind, we looked at how peer programs across the country report their progress. We reviewed 18 voter approved transportation measures across nine states, ranging from Los Angeles County's 120 billion dollar Measure M to Seattle's 930 million dollar levy. Of these 18, we'll look at five measures in more detail later in the presentation. Santa Clana Coward Santa Clara County and Nashville serve as dashboard examples within the key insights. And Seattle, Phoenix, and Columbus are the peer spotlights. Across these programs, six key insights emerge consistently. Here they are at a glance. Organize around the voter promise, lead with a map, budget versus spending transparency, list targets and show progress, show outputs and impact separately, and build layers of detail. The first insight starts with the foundation of any SERTAX program, the voter promise. Organizing the dashboard around the voter promise means structuring it by the same categories listed in the ballot language. This allows residents to trace their tax dollars directly to the commitments approved by voters. Santa Clara County's Measure B is an example. The Measure B dashboard is organized entirely by the measure's ballot categories, such as local streets and roads, bicycle and pedestrian projects, and transit operations. So each investment is presented within the commitment it supports. Once the dashboard reflects what was promised, the next consideration is to help residents see where those investments are taking place. Leading with a map can address that directly. An interactive map allows residents to view projects by location, such as their neighborhood or district, and connect the program to the places they know. Nashville's Choose How You Move program is an example. Residents select a planning area or council district, and the map displays capital investments to date with layers for traffic signals, sidewalks, complete streets, and transit service upgrades. Beyond where investments are located, it's equally important to show how program funds are being managed. That's the focus of budget versus spending transparency, which presents budgeted amounts alongside actual spending over the life of the program. The Move Seattle levy is an example. For each program area, the dashboard compares spending to date against the levy's total budget, and an annual spending chart that shows the pace of investment over time. While financial reporting shows how funds are spent, targets show what those funds are intended to achieve.
SUMMARIZED BY OPENPUBLICA AI
TRANSCRIPT VIA PUBLIC VIDEO
openpublica.com
openpublica.com