OPENPUBLICA · PUBLIC MEETING RECORD
Record of Proceedings
City Commission Work Session: Review of 2026 Citywide Survey Results – April 9, 2026
City Commission — Thursday, April 9, 2026
BodyWinter Park, Florida
SessionCity Commission
DateThursday, April 9, 2026
StatusFILED
Video Record
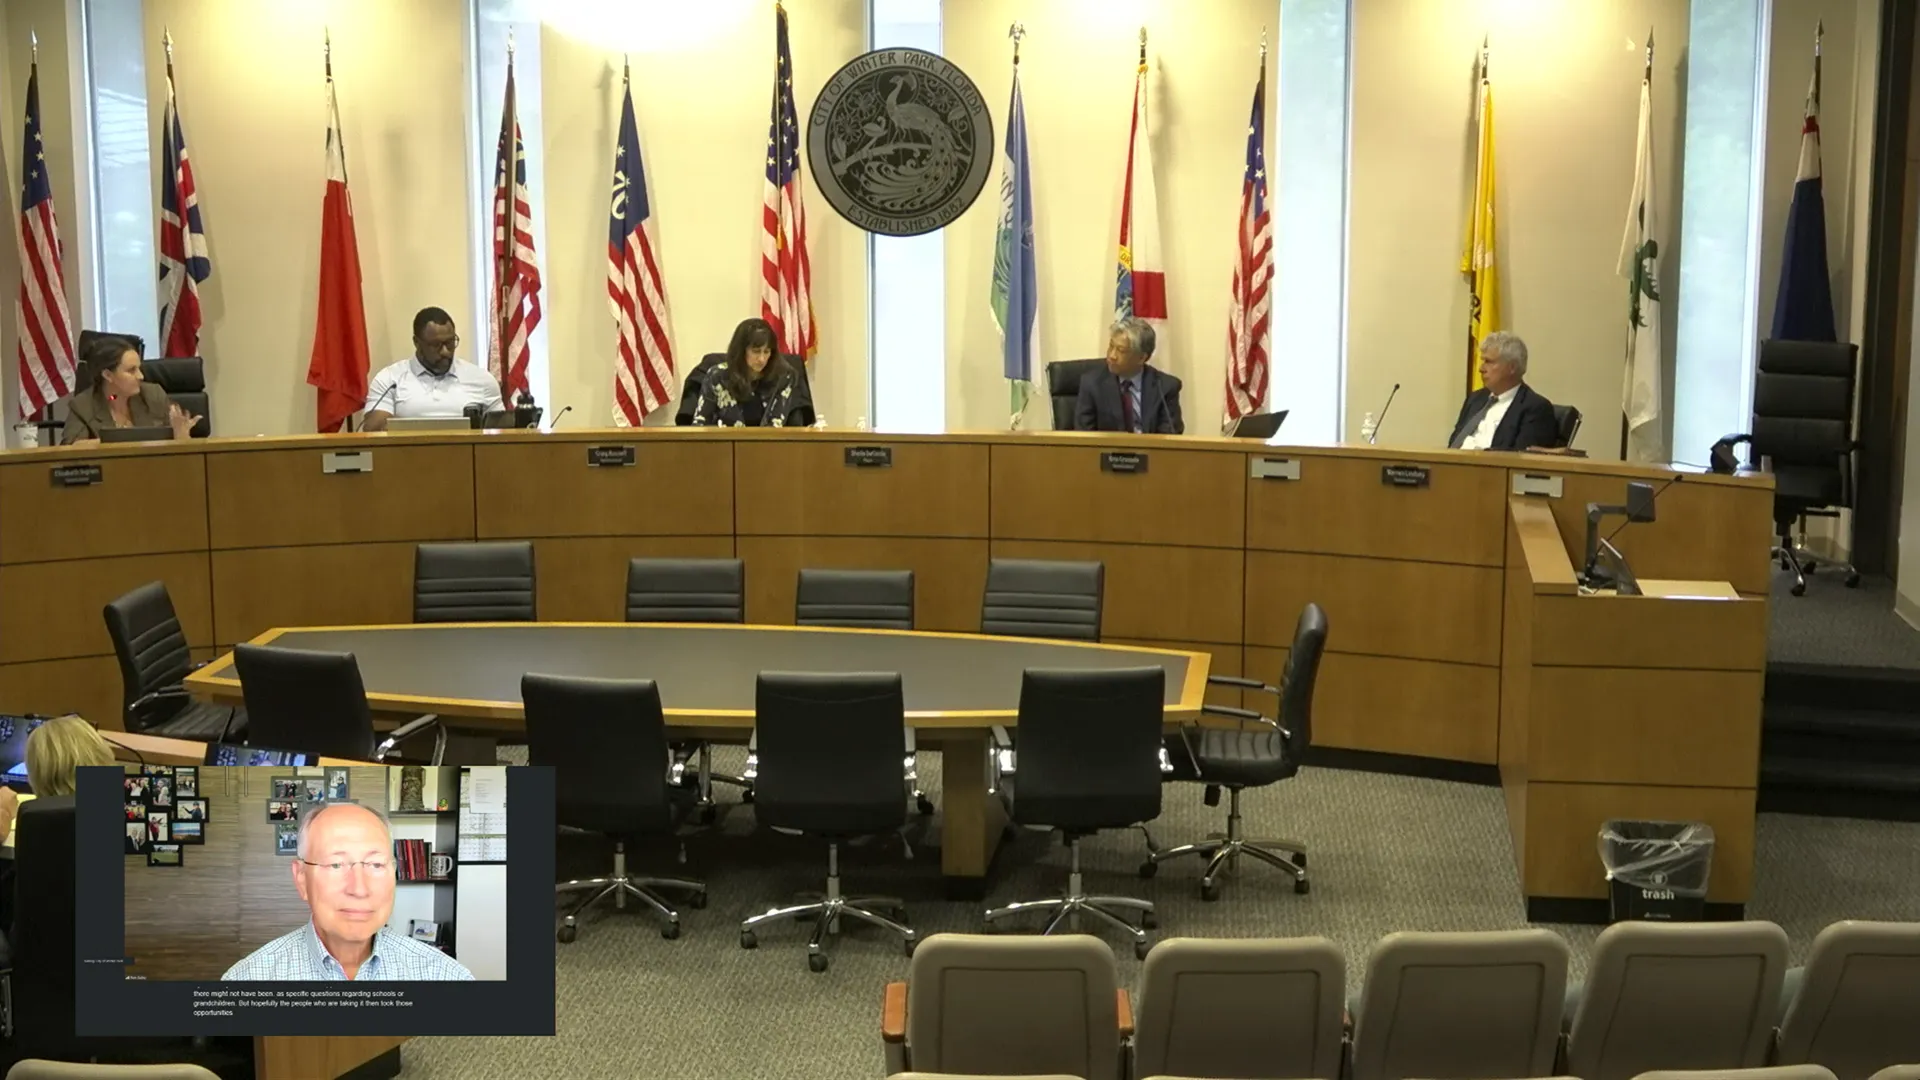
STREAMING COPY IN PREPARATION — RECORDING AVAILABLE FROM THE ORIGINAL SOURCE
Transcript — Verbatim
Speaker numbers apply only to this recording.
Discussion Breakdown — Share of Meeting
Public Engagement46%
Community Engagement19%
Public Safety12%
Youth Programs7%
Parks and Recreation5%
Procedural4%
Education Funding3%
Technology and Innovation2%
Budget Equity Analysis2%
Summary of Proceedings
City Commission Work Session: Review of 2026 Citywide Survey Results – April 9, 2026
The City Commission held a work session on April 9, 2026, at 3:30 PM to review the results of the 2026 Citywide Survey. The survey, conducted by OnPointe Insights, gathered 819 resident responses with a statistical margin of error of ±3.43% and an average completion time of 14 minutes. Founder/CEO Ron Gailey presented the findings through an interactive dashboard, which will be made publicly available.
Discussion Items
- Ron Gailey reported overwhelmingly positive feedback: 57% of respondents gave the city a 10 out of 10 for recommending it as a place to live; 71% said the city is going in the right direction. Compared to benchmarks from over 50 cities, Winter Park scored very high on key indicators.
- Residents highlighted the small-town feel, parks and green spaces, and city services as top strengths. Primary concerns included traffic and congestion, road and infrastructure maintenance, and managing growth while preserving community character.
- When asked to prioritize across 50 attributes, residents identified managing city growth wisely, showing fiscal responsibility, street/road repair, and traffic flow as the top areas needing improvement. Safety and crime prevention were rated highly satisfactory.
- Commissioners discussed strategies to increase survey participation among younger residents and other underrepresented groups. Suggestions included partnering with local schools (e.g., PTSAs), colleges (Rollins College), and city events; shortening the survey to under 10 minutes; adding questions about multigenerational housing, aging in place, and school-related topics (public, private, homeschool). Commissioner Cruzada noted that 90% of respondents owned homes, 74% had no children in the household, and over 50% were aged 60+, suggesting a need to capture perspectives of younger families and multi-generational households.
- City Manager Randy Knight confirmed the survey data will drive the upcoming strategic planning session on April 29, 2026, and the budget process. He emphasized that the results will be an active tool, not shelved.
- Commissioners expressed interest in conducting the survey annually to track trends and improve outreach.
Key Outcomes
- The survey results will be released to the public on April 10, 2026.
- Staff will integrate the findings into the strategic planning meeting (April 29, 2026) and budget discussions.
- Suggestions for future surveys include targeted outreach to younger residents via schools, colleges, social media, and city events; adding questions on multigenerational households, aging in place, and school support; and considering a shorter survey length.
- The interactive dashboard will allow ongoing filtering and analysis by city staff and commissioners.
Meeting Transcript
April 9th, 2026. Calling the meeting meeting to order. First item on discussion is a review of the 2026 citywide survey results and the discussion of the next steps. Randy, take it away. Thank you, Mayor. As you know, we've uh been conducting a citizen survey that's concluded, and to the purpose of today's meeting is to kind of run through that survey. That survey was conducted by On Point Insights, and we have with us today via the wonderful world of Zoom or one of those programs, uh, Ron Gailey and Ryan Young with On Point Insights. And they're going to walk us through the survey, uh, kind of show us the interactive features that it that it has, and the and the way you can drill down and get more information as you want it. Uh, after today's meeting, uh, we will be releasing the tomorrow. We'll be releasing this uh the results to the public so that everybody can have access. So Ron, I'm assuming you can hear me. Uh we're gonna we're gonna I can hear you. All right, we'll turn it over to you. And and Melanie are you able to hear me all right? Yes. Perfect. I'm going to share my screen. Can oh, can I have access to share my screen? All right. All righty. Um let me collapse this up. Perfect. Okay. Um I would like to introduce myself very briefly, and Ryan, who's with me, and then we'll jump right into the results. Um, a little about me. I am uh I I started this company, uh started it only five years ago. Um, before that, I was working for Coca-Cola. I was the research director for them. I was working before that for Chase Bank and then another bank up in Seattle area as their research director. So all of my career has always been helping senior executives of uh big organizations make important decisions. And about five years ago, a city manager asked me if I would help them with their city survey, which I did, and when I finished doing that, I just said that's the career I want to have. So I started this company, we've helped company cities from all across the country, and we're happy to be able to work with you. Um, and so uh here I think I'm gonna move this out of the way. What you're looking at, one of the things that we do that people love is instead of presenting the result in a great big um PDF file or in a PowerPoint presentation, we give it to you in a dashboard. And you're looking at the dashboard right now, you will receive a link to the dashboard, and residents of your city will be able to click on the link to this dashboard and see what I'm going to be showing you today. And the dashboard is pretty easy to navigate along the left-hand side. You just click on anything that you would like to see, and you can learn and see that part of the survey. So it's very easy and very intuitively created. We were able to uh obtain an 819 responses. We had more than that, but a few of them were outside of your city and they were removed. But we have 819 that were done. Most of them came in from the city news, which is very successful, and you'll see more about that later on. Facebook, text message invites, email invites, Instagram, the website, and even one or two, a few on X. So they came from a variety of sources.
SUMMARIZED BY OPENPUBLICA AI
TRANSCRIPT VIA PUBLIC VIDEO
openpublica.com
openpublica.com